- SOLUTIONS
- SERVICES
- ABOUT US
- RESOURCES
- CONTACT
MANAGEMENT
ASSURANCE
ECOSYSTEM
Measuring the True Profitability: A holistic and granular approach
In today’s rapidly evolving but oversaturated market, the telecommunication industry has changed its way of working. It has started to merge or intersect with other industries, such as media and financial services, offer more variants of products and personalized services to valuable customers, and quickly embrace new technical advents and adapt to the latest offerings, like 5G. As a result, the process starts involving multiple departments in core strategy and decision making. But each department monitors one’s own set of KPIs, which are in isolation from others. As a result, easier to monitor KPIs like revenue, subscriber base, number of installations, and site upgrades get priority while the concept of profits and margins take a hit and, thus, the accountability of multiple cost items. To overcome this issue requires a rejig in overall strategy involving collaboration between departments and a change in success criteria from top-line growth (revenue-based) to bottom-line growth (profit-based) with a presence of every stakeholder in the Profit & Loss(P&L) view of the company, resulting in a single version of the truth.
Approach
A holistic and granular approach is an attempt to measure the true profitability of customers, products, network assets, and geographical regions by adopting a more structured and methodical approach. The whole process can be divided into four steps, as shown below.

1. Understand: Companies have most of the information needed for profit calculation, but it is scattered across multiple systems and departments. In this step, meetings with different stakeholders are done to analyze existing business models and understand their revenue & cost overheads, current margin computation methodology, and available data sources.
2. Develop: Once all the line items related to revenue and cost items are identified, a logic is developed
- a. to align the items into meaningful categories. For example: Usage revenue (within/outside product), Interconnect Revenue (Domestic/International), Network cost (e.g. Rentals/Energy), Insurance (Handset/Managed Services), etc.
- b. to define cost model for ascertaining the per-unit cost. E.g., total network site cost is divided by overall network site usage(duration) to derive a cost per sec, and then cost is multiplied to obtain the network cost per transaction. Same way, a subscriber’s revenue is reverse mapped to network sites in the ratio of the subscriber’s usage.
3. Process and Analyse: Once the logic is developed, different revenue and cost line items are processed and analyzed at the granular level possible. The state-of-the-art hardware & computing engine is put in place, combining multiple sources from different systems and running profilers to derive the final margin in a scheduled way.
4. Compute: This step involves setting up a system with features of roll-up and slice-dice to derive the final margin against different parameters. Rules are defined to include or exclude the line items based on the type of level. E.g., margin can be computed against different parameters like Customer, Product, Segment, State, etc. as shown below.
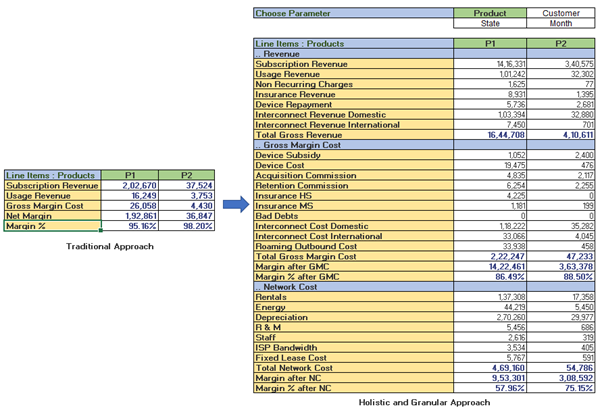
Fig. Margin Computation P&L View Illustration.
Use Cases
Some of the use cases where Subex has delivered using the given methodology are as follows:
1. Visibility of network cost components in product profitability: In the given engagement, the network team wanted accountability from the product team while designing new products as the network team tries hard to meet the network requirements for the products. Subex created a detailed P&L view accounting in all network cost components for the products based on their usage and derived cut-off price points for the products given the services offered. We were able to identify some products with high sales revenue, but with negative or shallow margin after network cost allocations. The whole process brought more transparency, seeking coordination between both departments.
2. Identifying high profitable customers: In this engagement, the client wanted to change the criteria of most valued customers, from revenue to profits. Subex helped the client to understand the exact contribution each customer made to the bottom line. The client acknowledged that the revenue method had been deceptive and inaccurate as two customers having similar revenue can have varying costs. Also, it helped the client identify the key cost components, making high revenue customers into low margin customers.
Conclusion
In a situation when prices are becoming harder to intervene, optimizing cost and service offerings become essential to push margins and require re-defining the yardstick of success from revenue & sales to profitability. The proposed holistic and granular P&L view increases transparency leading to more actionable insights and a better understanding of the cost structure, helping identify root cause drivers.
See how Subex Analytics Centre of Trust can help your business.

Anuranjan Prasad is a senior Data Scientist at subex. He has been in the analytics industry for over 7 years, with experience in Telecom and Insurance domains. At Subex, he is responsible for statistical modelling and algorithm design for business requirements. He is also involved in doing research activities to implement new ideas into telecom domain.