- SOLUTIONS
- SERVICES
- ABOUT US
- RESOURCES
- CONTACT
MANAGEMENT
ASSURANCE
ECOSYSTEM
The Steady Decline in Operating Cash Flow for Telcos
How does one gauge the financial performance of a telco? Earnings growth, commonly measured using EBITDA, is favored by many analysts. But how much of the story does this metric tell? For a telco, OIBDA (Operating Income Before Depreciation and Amortization) may be a bit more insightful given that it generally excludes income and financial events outside of the core business. Of course, there are many secondary metrics that often get attention during earnings calls and we know them well: ARPU, postpaid vs. prepaid mix, subscriber growth & churn, etc. I’m going to make my case in this space for another metric that should be top-of-mind for executives, corporate boards and analysts: Operating Cash Flow or OCF.
Let’s start with a key component of OCF which is Capex Intensity. This is simply the ratio of Capex to Revenue. Ideally, it should be normalized to exclude one-time significant events like investments in spectrum. Subex conducted a study of financial results for 44 large tier operators between 2011-2015*. One of the interesting, if unsurprising, findings is that Capex Intensity has been rising steadily. Consider the following chart. In 2011, the average Capex Intensity was 15.9% for the operators in our study. In 2015 it was 18.9%. We also have data going back to 2008 which shows an industry average of 13.3%!
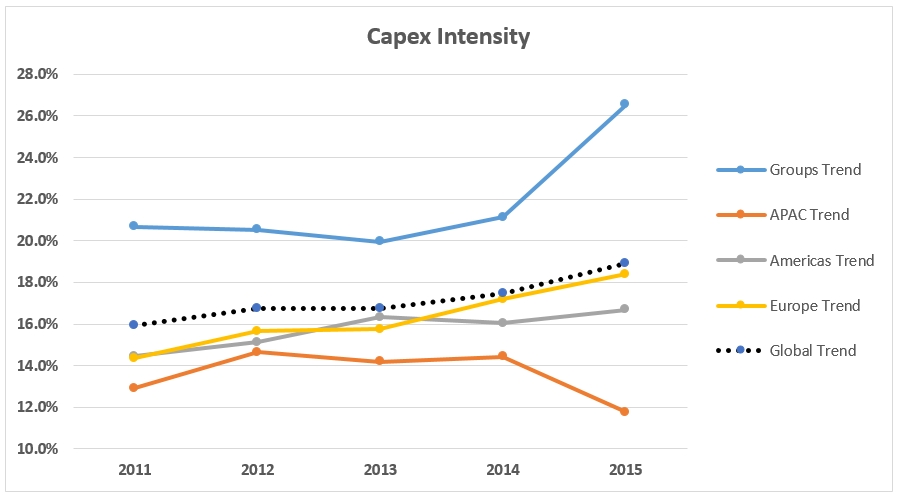
The chart shows Capex Intensity for Americas and Europe are slowly tracking upward. In 2015, there was a huge spike for the big groups while there was a dip for APAC. This is largely explained by inclusion of the big Chinese operators (China Mobile, China Telecom and China Unicom) in the “Groups” category provided by Gartner due to their scale. Capex Intensity for these three was over 38% in 2015 as China scrambles to build out LTE infrastructure for all those folks using WeChat and shopping on Alibaba!
Now consider the five-year trend for OIBDA.
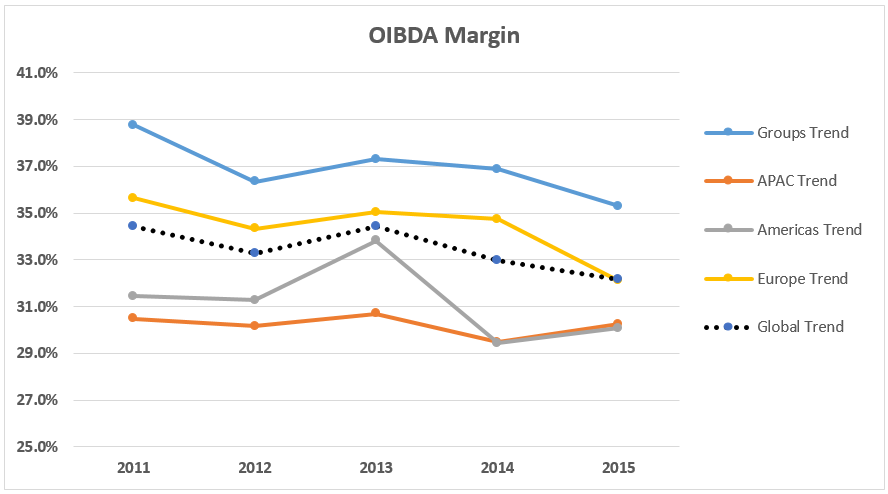
Between 2011 and 2015, for the operators in the study, OIBDA margin declined an average of 2.2%
This brings me back to Operating Cash Flow (OCF). Anyone who runs a business will tell you that free cash from operations is their most watched number. I ran a commercial kitchen with 5 employees for several years and, believe me, I lost many nights sleep over our cash position. Then I got back into telecom. What was I thinking? But I digress…
My argument is that the influence of Capex tends to get buried in financial statements. Certainly telcos have to invest in networks to fuel subscriber growth and deliver a rich customer experience. But the trends in Capex Intensity (up) and OIBDA margins (down) are unmistakable and they compound each other. Take a look at the next chart.
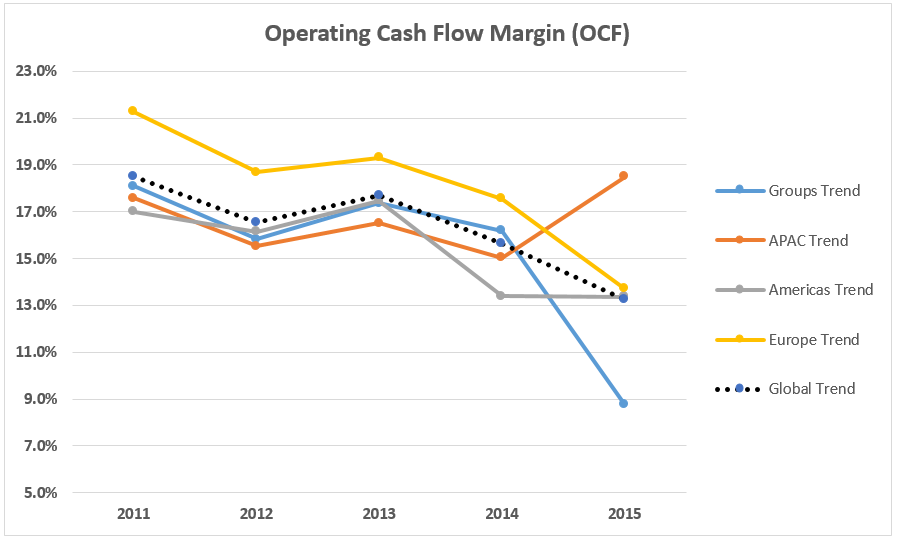
OCF = (OIBDA – Capex)/Revenue, or equivalently, OIBDA Margin – Capex Intensity. So it is a fairly complete measure of the operational health of an operator because it considers Revenue, Opex and Capex. Anything left over can be used for debt service, taxes and dividends. Between 2011 and 2015, OCF among operators globally fell 5.3%. This is a significant observation.
What can reverse the trend? In the long term, business models that better compete with OTT players is certainly a hot topic of discussion. Perhaps SDN and NFV will tilt network economics back in the telcos’ favor. In the near term, it is clear that better Capex governance and controls can at least slow the trend. Keep in mind that 100% of Capex savings flows to the bottom line, while an incremental dollar of revenue only contributes the margin amount.
I see these industry numbers as a call to action—managing and reducing Capex should be an imperative at the corporate board level for every telco. Capex governance includes:
- Giving commercials and finance teams some of the same visibility to asset utilization as the network teams.
- Aggressively exploiting cases where assets can be reused before purchasing new
- Proactively selling off excess assets while they still have value to other telcos
- Keeping financial and technical records of assets fully aligned
- Placing better controls on high-risk assets at the edges of the network such as CPE, set top boxes, access points, small cells and handsets
I’ll close with this observation— while SDN and NFV bring the promise of reducing Capex via virtualization and commoditization, the economics are not yet proven and the transition will take years. Early adopters of NFV have found, for example, that it may take multiple Virtual Network Functions (VNFs) to replace the same function performed by one instance of legacy software on dedicated hardware. This erodes Capex savings from virtualization. The lesson is that exploiting approaches to reduce Capex in the existing network should not get lost when chasing the promise of virtualization.
If you would like more background on the methodology used for our analysis, and the operators we included, please write to me.
*Raw financial data supplied by Gartner. Analysis by Subex.

Portfolio Head – Network Analytics
Andy has 20+ years of experience in engineering management, business operations and IT, primarily with Tier 1 operators including Level 3, MCI and GTE. His responsibilities included leading IT development teams that built mission-critical network management, provisioning and inventory systems with thousands of users. Prior to joining Subex, Andy was a Senior Manager overseeing a Data Governance organization at a major Internet Services provider. Andy graduated from the University of Pennsylvania with degrees in Electrical Engineering and Economics (Wharton). He holds an MBA from the University of Colorado.